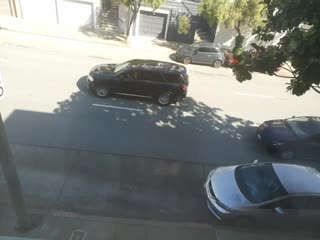
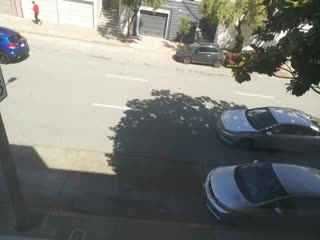
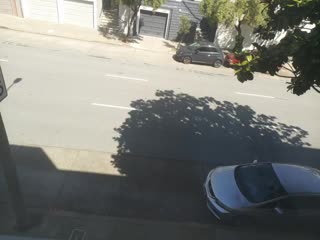
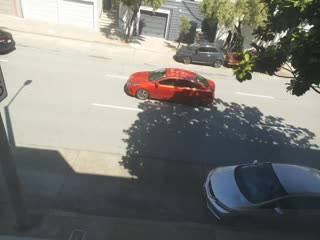
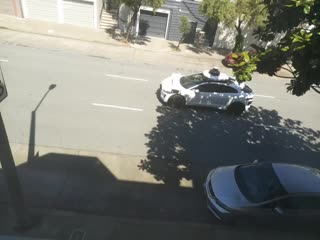
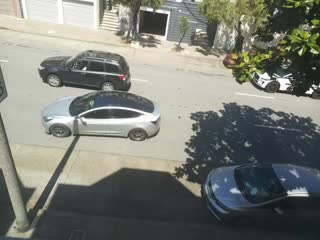
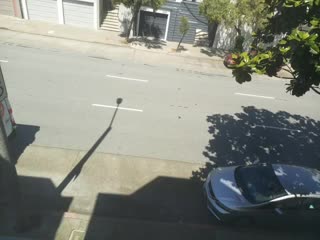
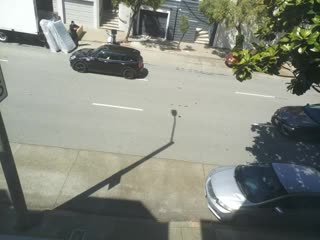
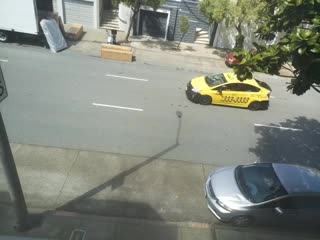
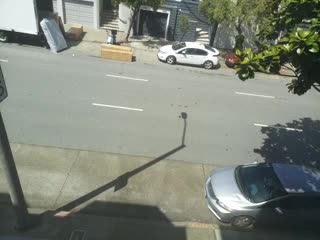
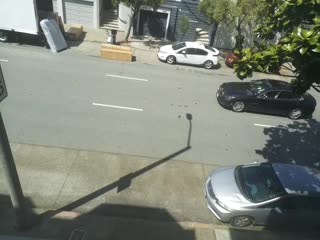
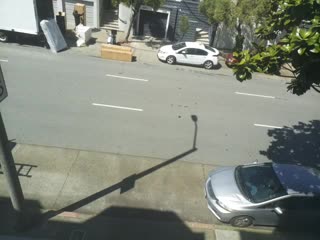
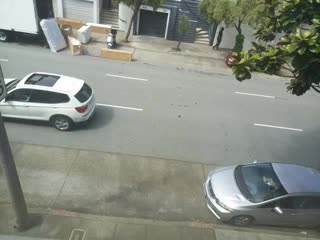
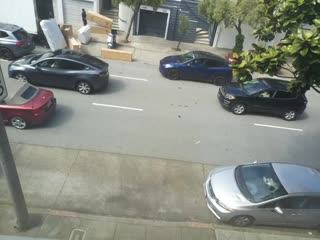
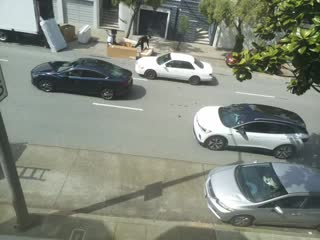
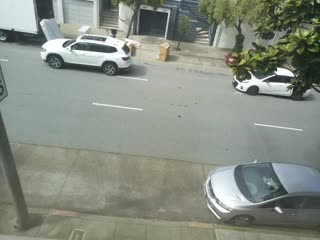
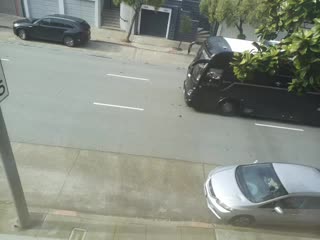
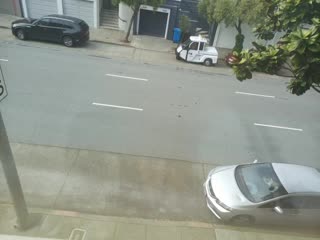
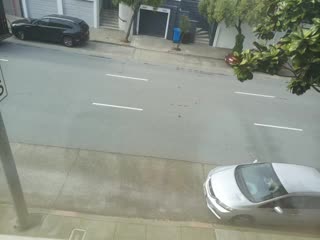
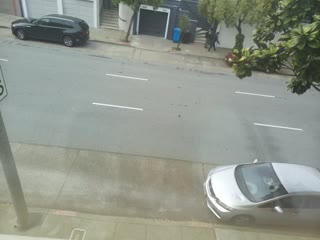
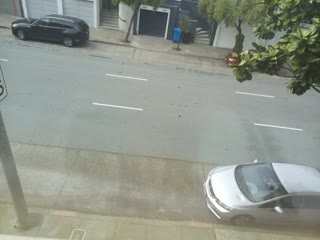
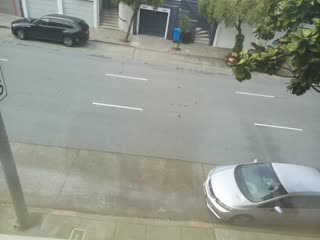
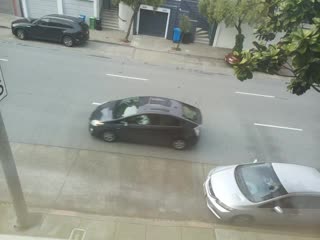
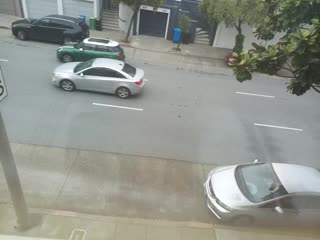
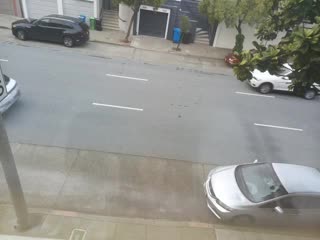
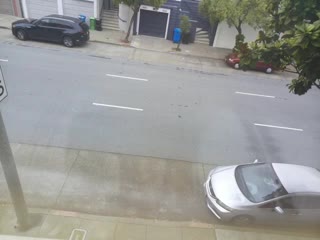
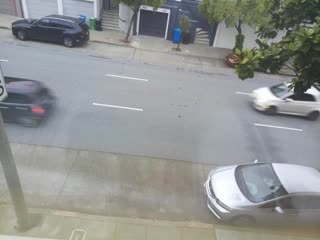
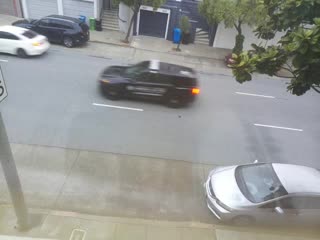
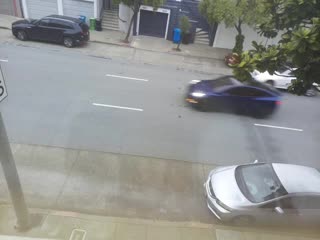
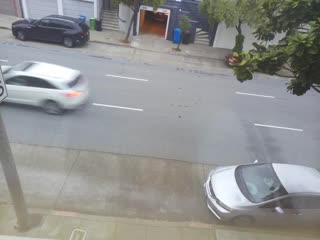
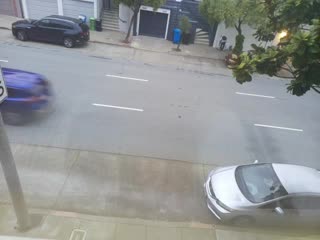
Waymo Pulse SF

Review Car Analysis Recordings

Analysis for Monday, 14.04.2025

Waymo Sightings

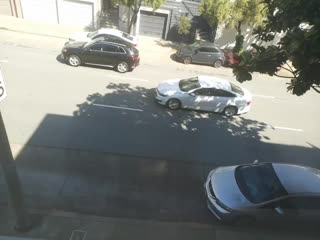
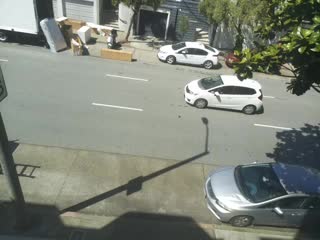
Spotted 437 Waymo vehicles.

This makes up 3.39% of all identified cars.

General Statistics

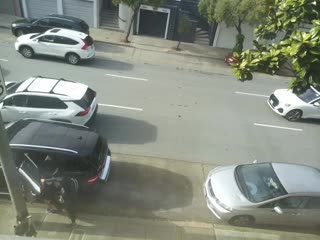
Total cars analyzed: 12884

Motorbikes: 311 (2.12%)

Pedestrians: 994 (6.78%) (40 with dogs - 4.02%)

Cyclists: 26 (0.18%)

Total objects detected: 14652

Car Color Distribution (Top 10)

  • White: 3489 (27.08%)
  • Black: 2389 (18.54%)
  • Grey: 1763 (13.68%)
  • Silver: 1566 (12.15%)
  • Dark Grey: 1461 (11.34%)
  • Red: 596 (4.63%)
  • Blue: 593 (4.6%)
  • Dark Blue: 376 (2.92%)
  • Yellow: 104 (0.81%)
  • Light Blue: 82 (0.64%)
  • Others: 465 (3.61%)

Car Make Distribution (Top 10)

  • Toyota: 2564 (19.9%)
  • Honda: 1273 (9.88%)
  • Ford: 1105 (8.58%)
  • Tesla: 1079 (8.37%)
  • Unknown: 800 (6.21%)
  • Subaru: 633 (4.91%)
  • Bmw: 536 (4.16%)
  • Lexus: 494 (3.83%)
  • Mazda: 445 (3.45%)
  • Mercedes-benz: 323 (2.51%)
  • Others: 3632 (28.19%)

Car Age Distribution

  • 0-2 Years: 128 (0.99%)
  • 2-4 Years: 2518 (19.54%)
  • 4-6 Years: 4788 (37.16%)
  • 6-8 Years: 3044 (23.63%)
  • 8-10 Years: 1215 (9.43%)
  • 10+ Years: 1191 (9.24%)

Car Value Distribution

  • $0-$10,000: 708 (5.5%)
  • $10,000-$20,000: 3905 (30.31%)
  • $20,000-$30,000: 4190 (32.52%)
  • $30,000-$40,000: 2247 (17.44%)
  • $40,000-$50,000: 1109 (8.61%)
  • $50,000-$60,000: 220 (1.71%)
  • $60,000-$70,000: 76 (0.59%)
  • $70,000-$80,000: 41 (0.32%)
  • $80,000-$90,000: 26 (0.2%)
  • $90,000-$100,000: 19 (0.15%)
  • $100,000+: 343 (2.66%)

Traffic by Hour

Waymo Count & Percentage by Hour